[BEANS] Very short introduction to the web interface
This short tutorial describes:
the web interface to BEANS software
how to create a dataset
upload a file into BEANS to the newly created dataset (as a new table)
make a simple plot based on the table
Our own BEANS server is located at beans.camk.edu.pl. If you have there an account, please go there and log in.
The main page of BEANS looks like this:
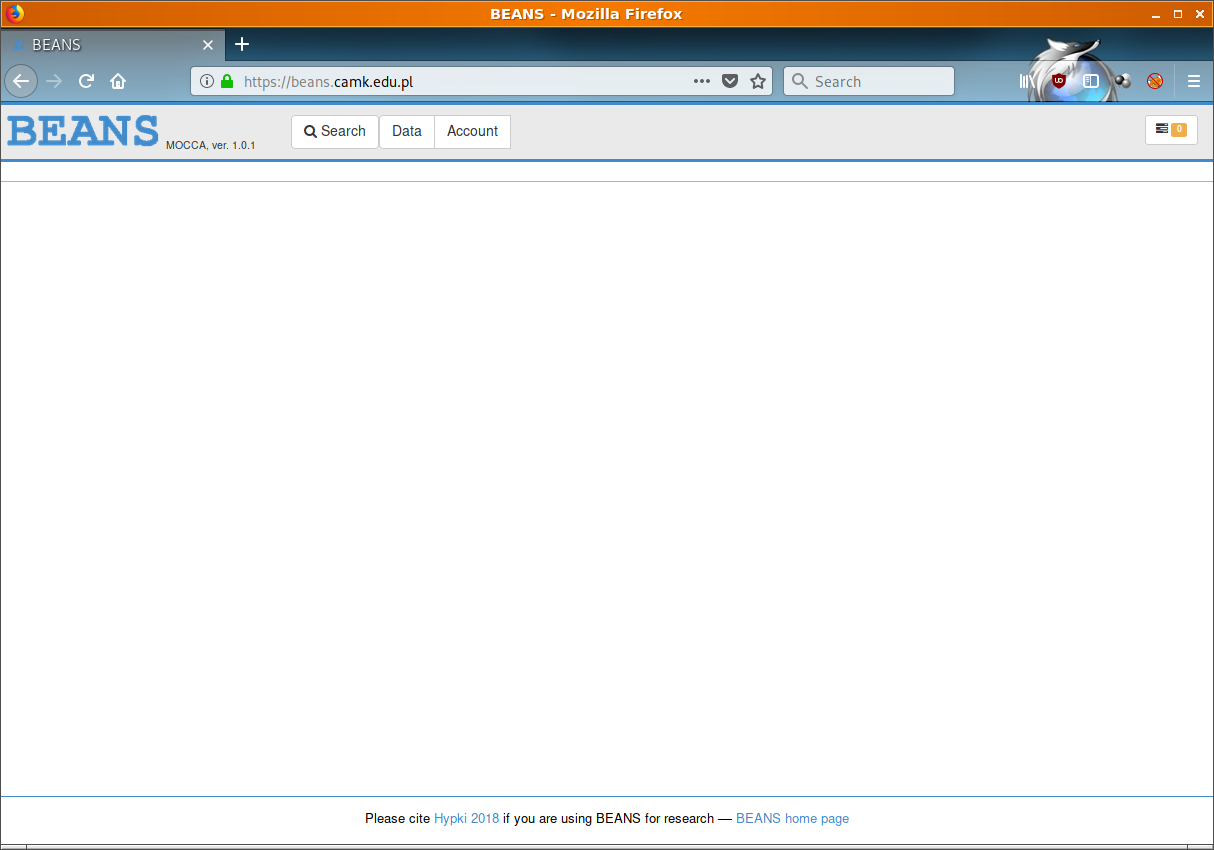
The main menu on the top contains (from the left):
- "Search" button - it is used to quick search of notebooks, datasets and tables
- "Data" button - it is used, among others, to create new notebooks and datasets
- "Account" button - it gives access to some user specific options and to manage groups of users
- on the right there is button which shows statuses of jobs
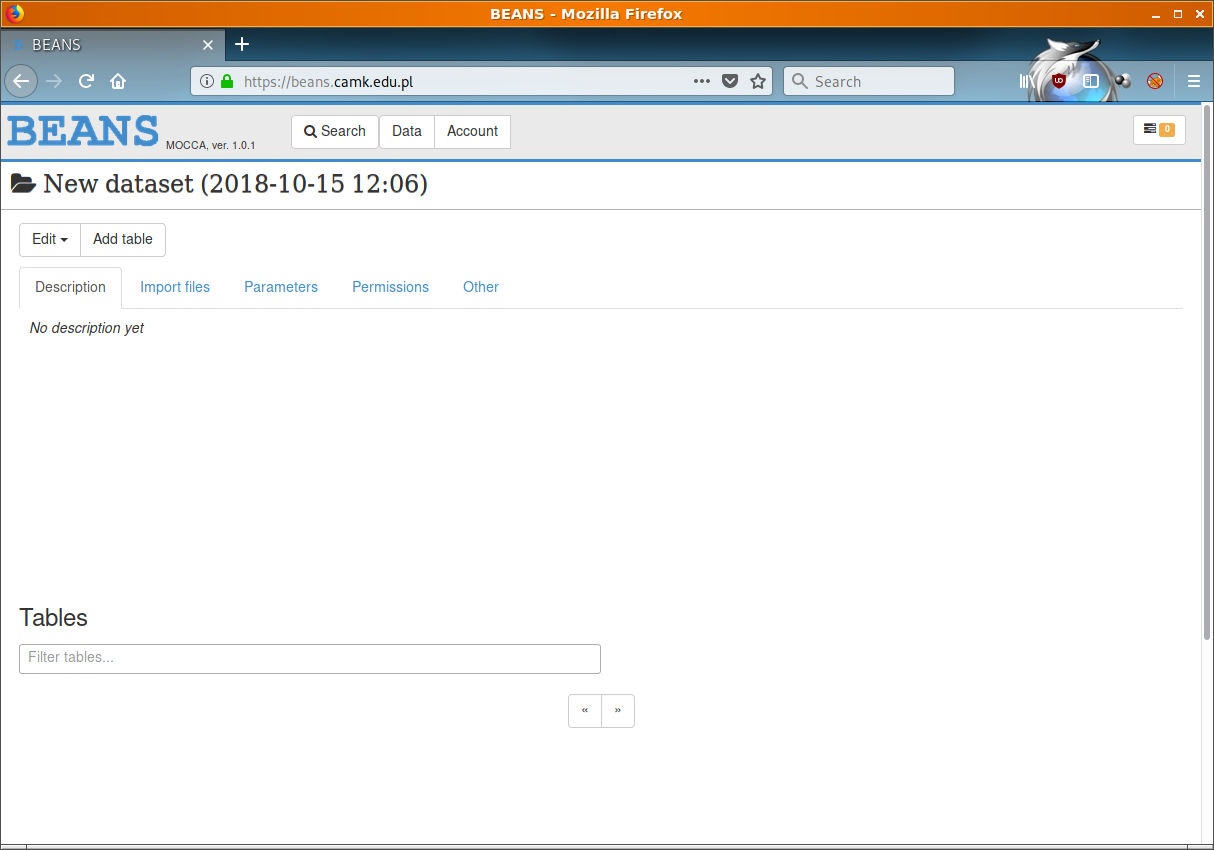
In order to create a dataset choose in menu "Data" -> "New dataset".
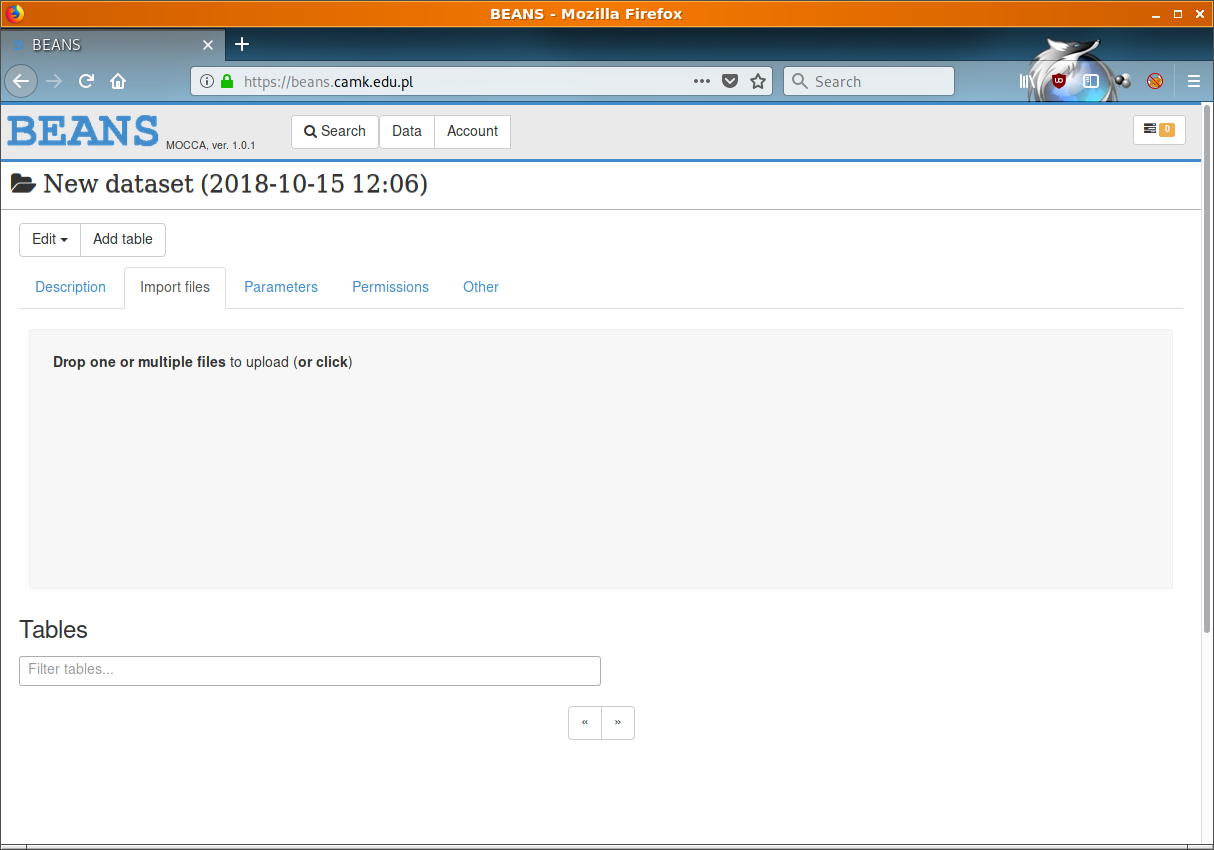
Under the tab "Import files" one can upload one or many files into BEANS to this specific dataset. Just drag a file on the panel or click to it to add the file.
For testing create a simple text file on your hard drive:
# x y
1    1
2    2
3    3
4    4
5    5
6    6
7    7
8    8
9    9
10    10
Please notice, that the first line contains the header with the names of the columns. Once the file is imported there will be possible to use column names (x, y) in scripts and plots.
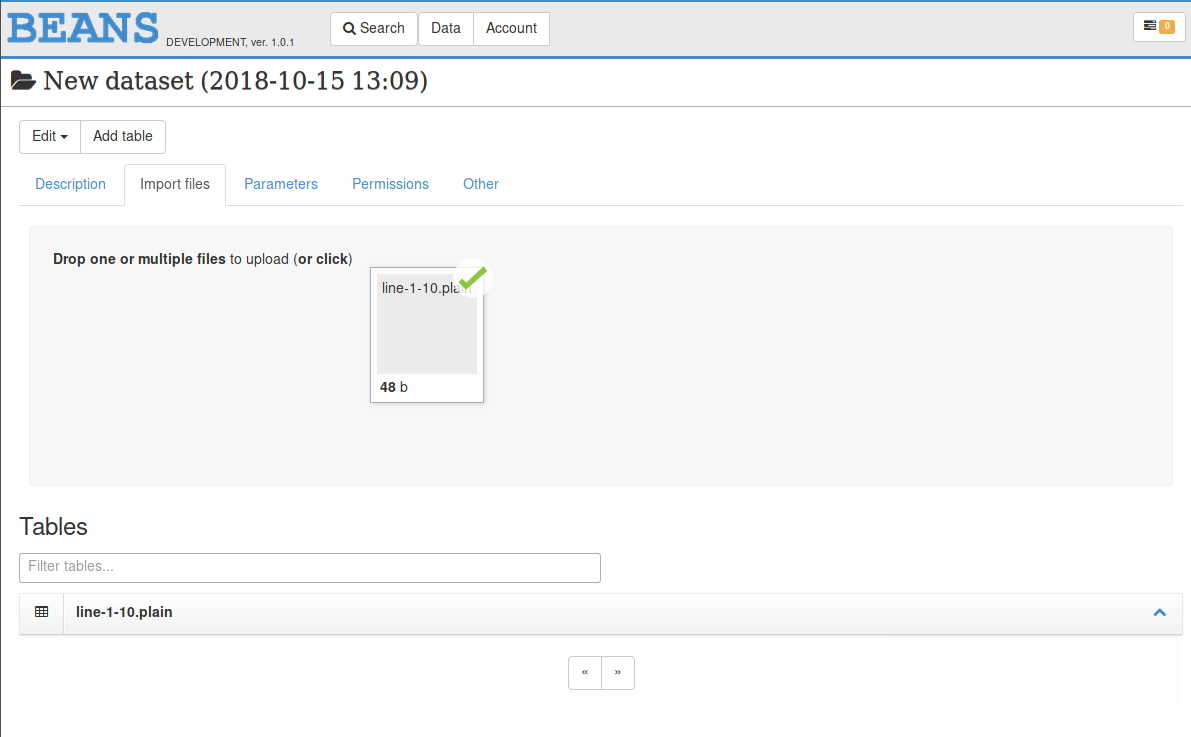
Save the file and upload it to the dataset. Once you are done you should see a new table on the bottom.
Now, we are ready to create a notebook and a plot. Choose in menu "Data" -> "New notebook". This will create the empty notebook.
![]()
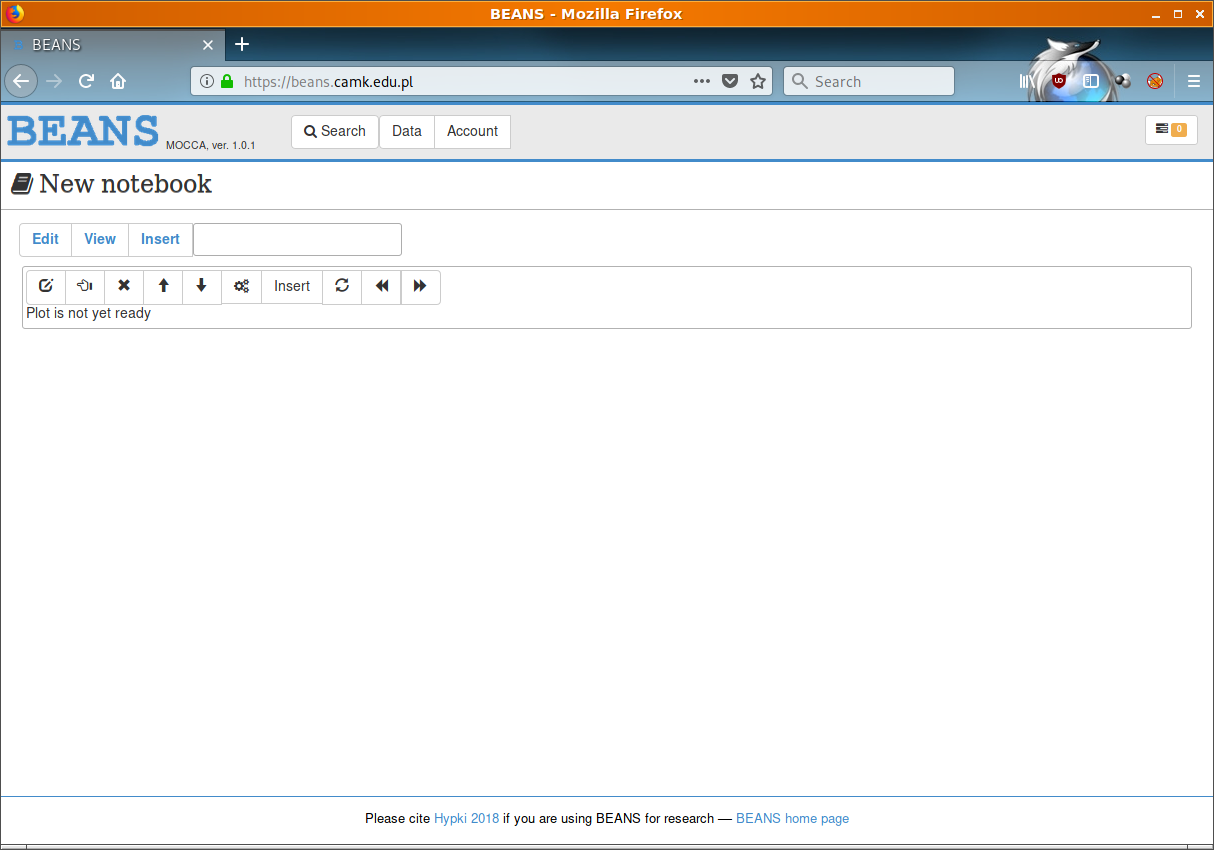
Every notebook is a scrollable list of entries of different types. Menu for notebook is on the top - it will scroll down with the view so it will be always at hand.
For this tutorial we will create only one entry - a plot entry. Choose in notebook's menu "Insert". This will open a dialog for you with the list of possible entries to add.
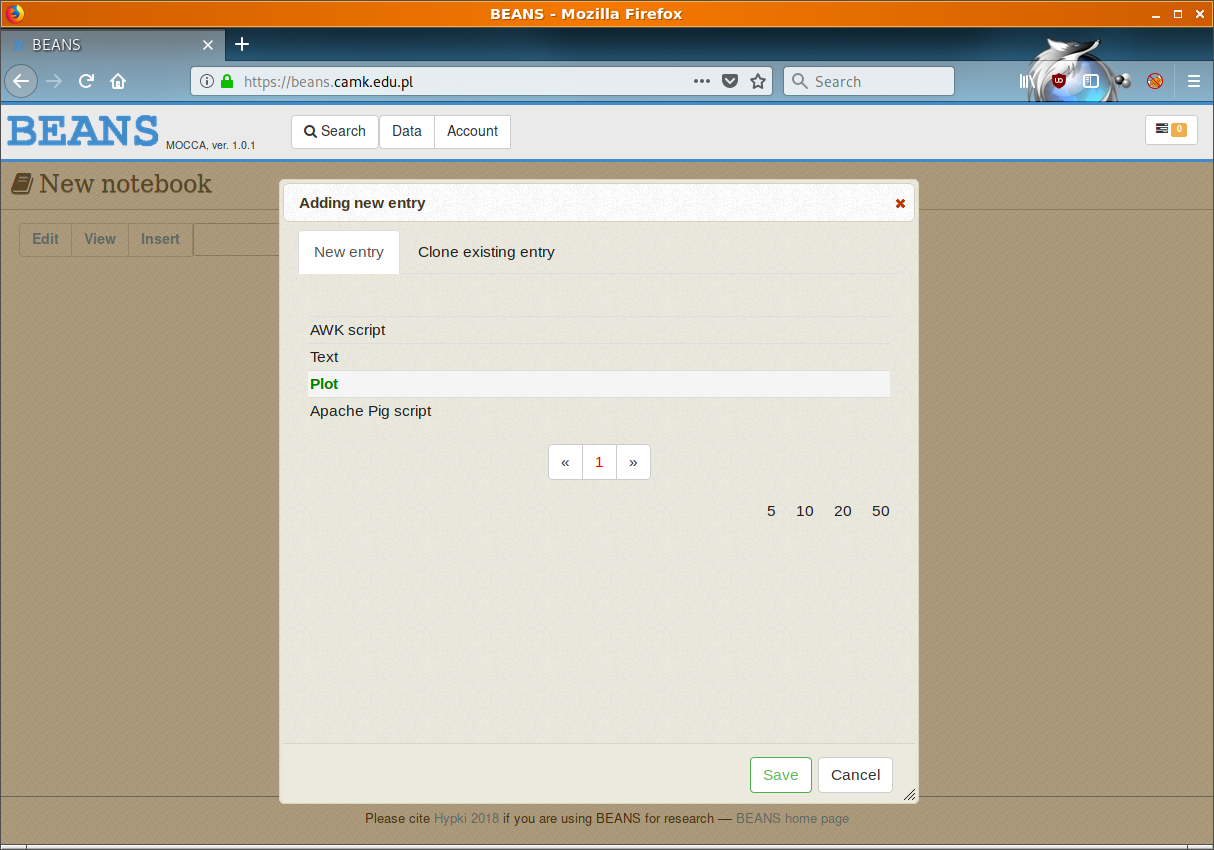
Let's choose "Plot" entry and then "Save" button. This will add the "plot" entry to the notebook. Let's click to this entry with the mouse button and the menu for this entry will appear.
The most left button on entry's menu allow to edit the entry. The entry (of the plot) in edit mode looks like this:
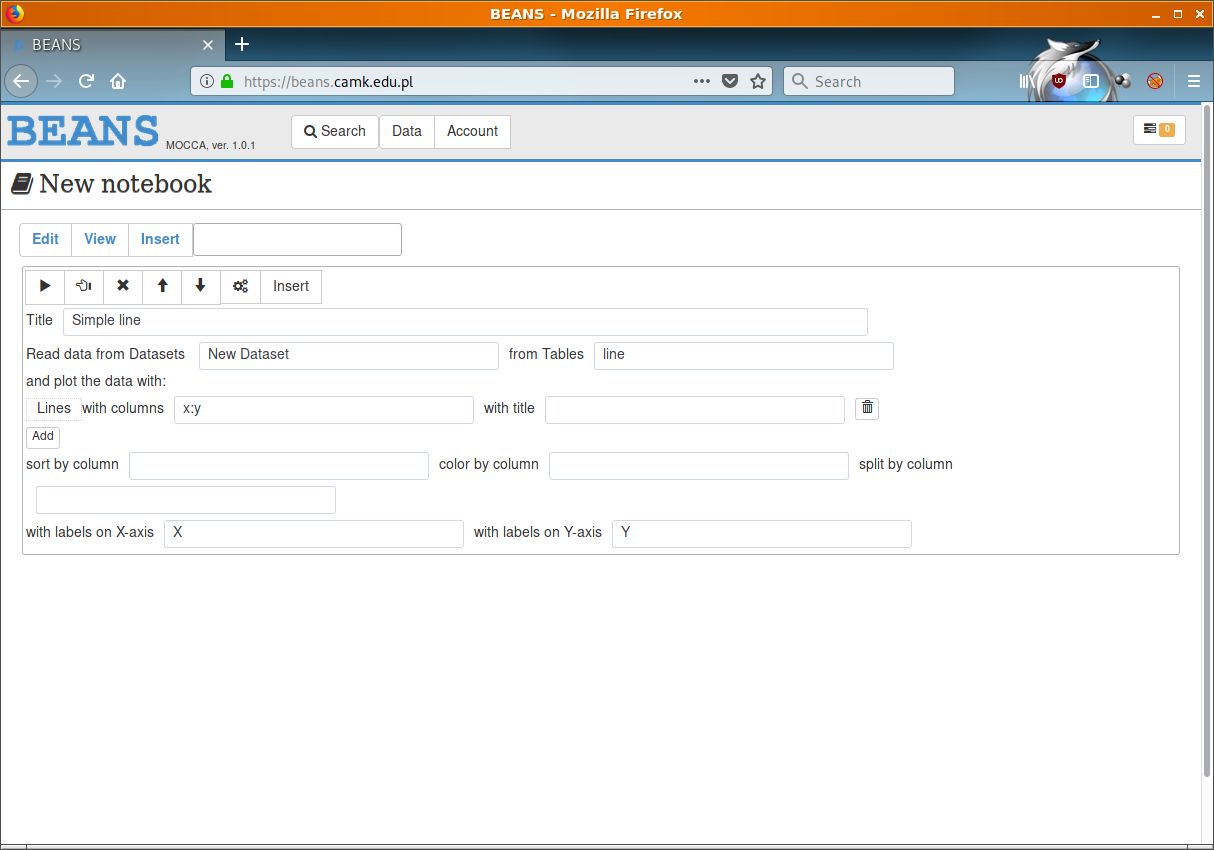
There are a few fields which (even in this simple tutorial) needs en explanation:
- In the line "Read data from Datasets" there are two input boxes. In the first one you need to specify a query for datasets and in the second for the tables. In our case "New Dataset" will find one dataset - the one which was created earlier. And the query "line" in the second search box will find our file which we uploaded and created the table "line-1-10.plain".
Be careful: if you will put there too general search queries you might end up plotting the whole MOCCA database into one plot (over 100 TBs)!
- later, in the input box the term "x:y" means that the plot should make a line of two columns: x vs. y. Because in our test file we had in the first row the names of the columns we can now use them to make this plot.
After clicking to "play" button (the most left one) and waiting a bit the entry should look like this:
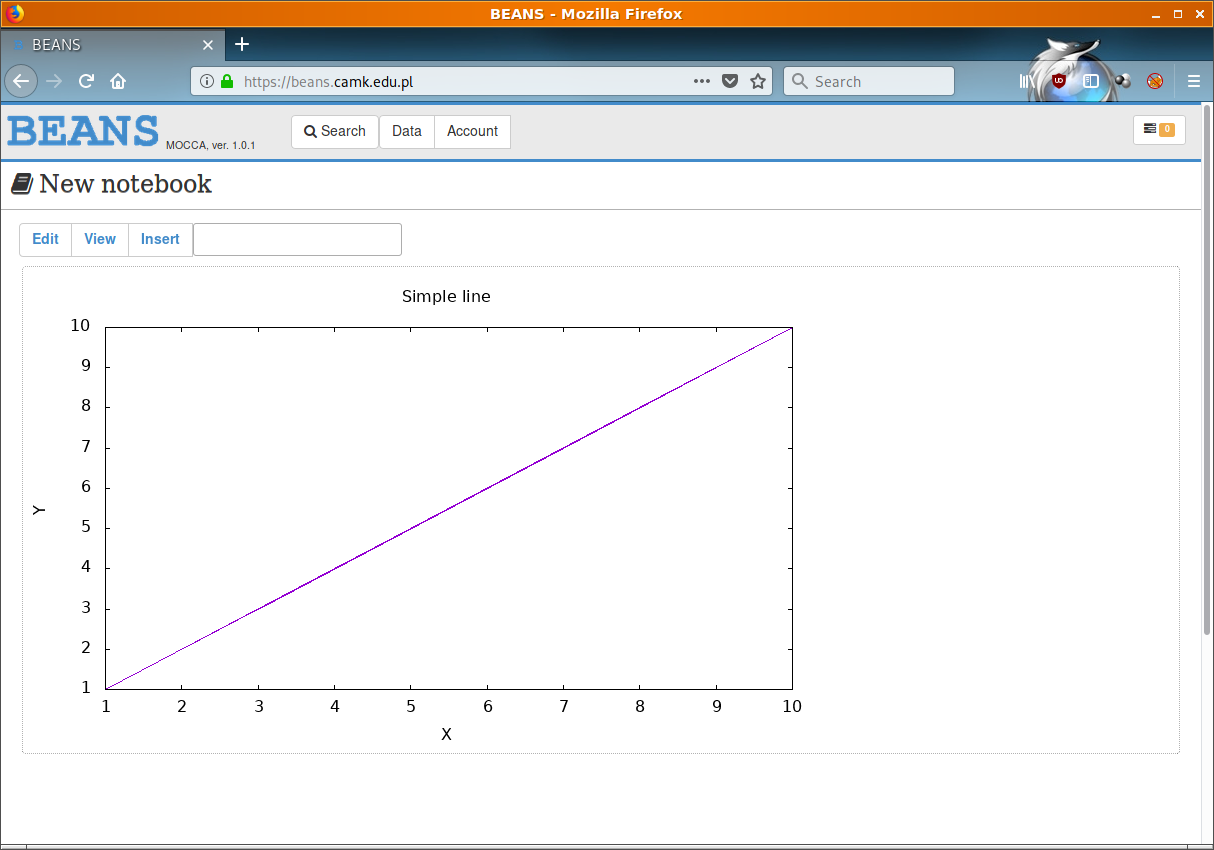
End.